On-brand charts in Slides, from Sheets data to native shapes
Sheets keeps adding chart types. None of them look like your brand once they're in a deck. Draw the chart as shapes instead, and every bar takes your colours and type.

- Sheets added box and whisker, combo and multi-series scatter charts this year. Linked into Slides, they still carry Sheets’ look.
- Linked charts are right when numbers change weekly. For launch decks and printed collateral, draw the chart as native shapes.
- Bar charts need only rectangles and text boxes: a short Apps Script draws them on the current slide.
- Curves (lines, areas, donuts) come in as SVG with SVG to Slides. Labels stay as live text boxes.
More chart types, same look
Sheets has had a busy year for charts: combo charts and scatter charts with multiple x-series in July, and native box and whisker charts rolling out in October. All useful for analysis.
Paste one into Slides and it still looks like Sheets: its own fonts, gridlines and colours. In a sales deck built on your type and palette, a default chart is the one thing on the slide that isn’t yours. (For why default type reads as default, Linus Boman’s video essays on typography are a good watch.)
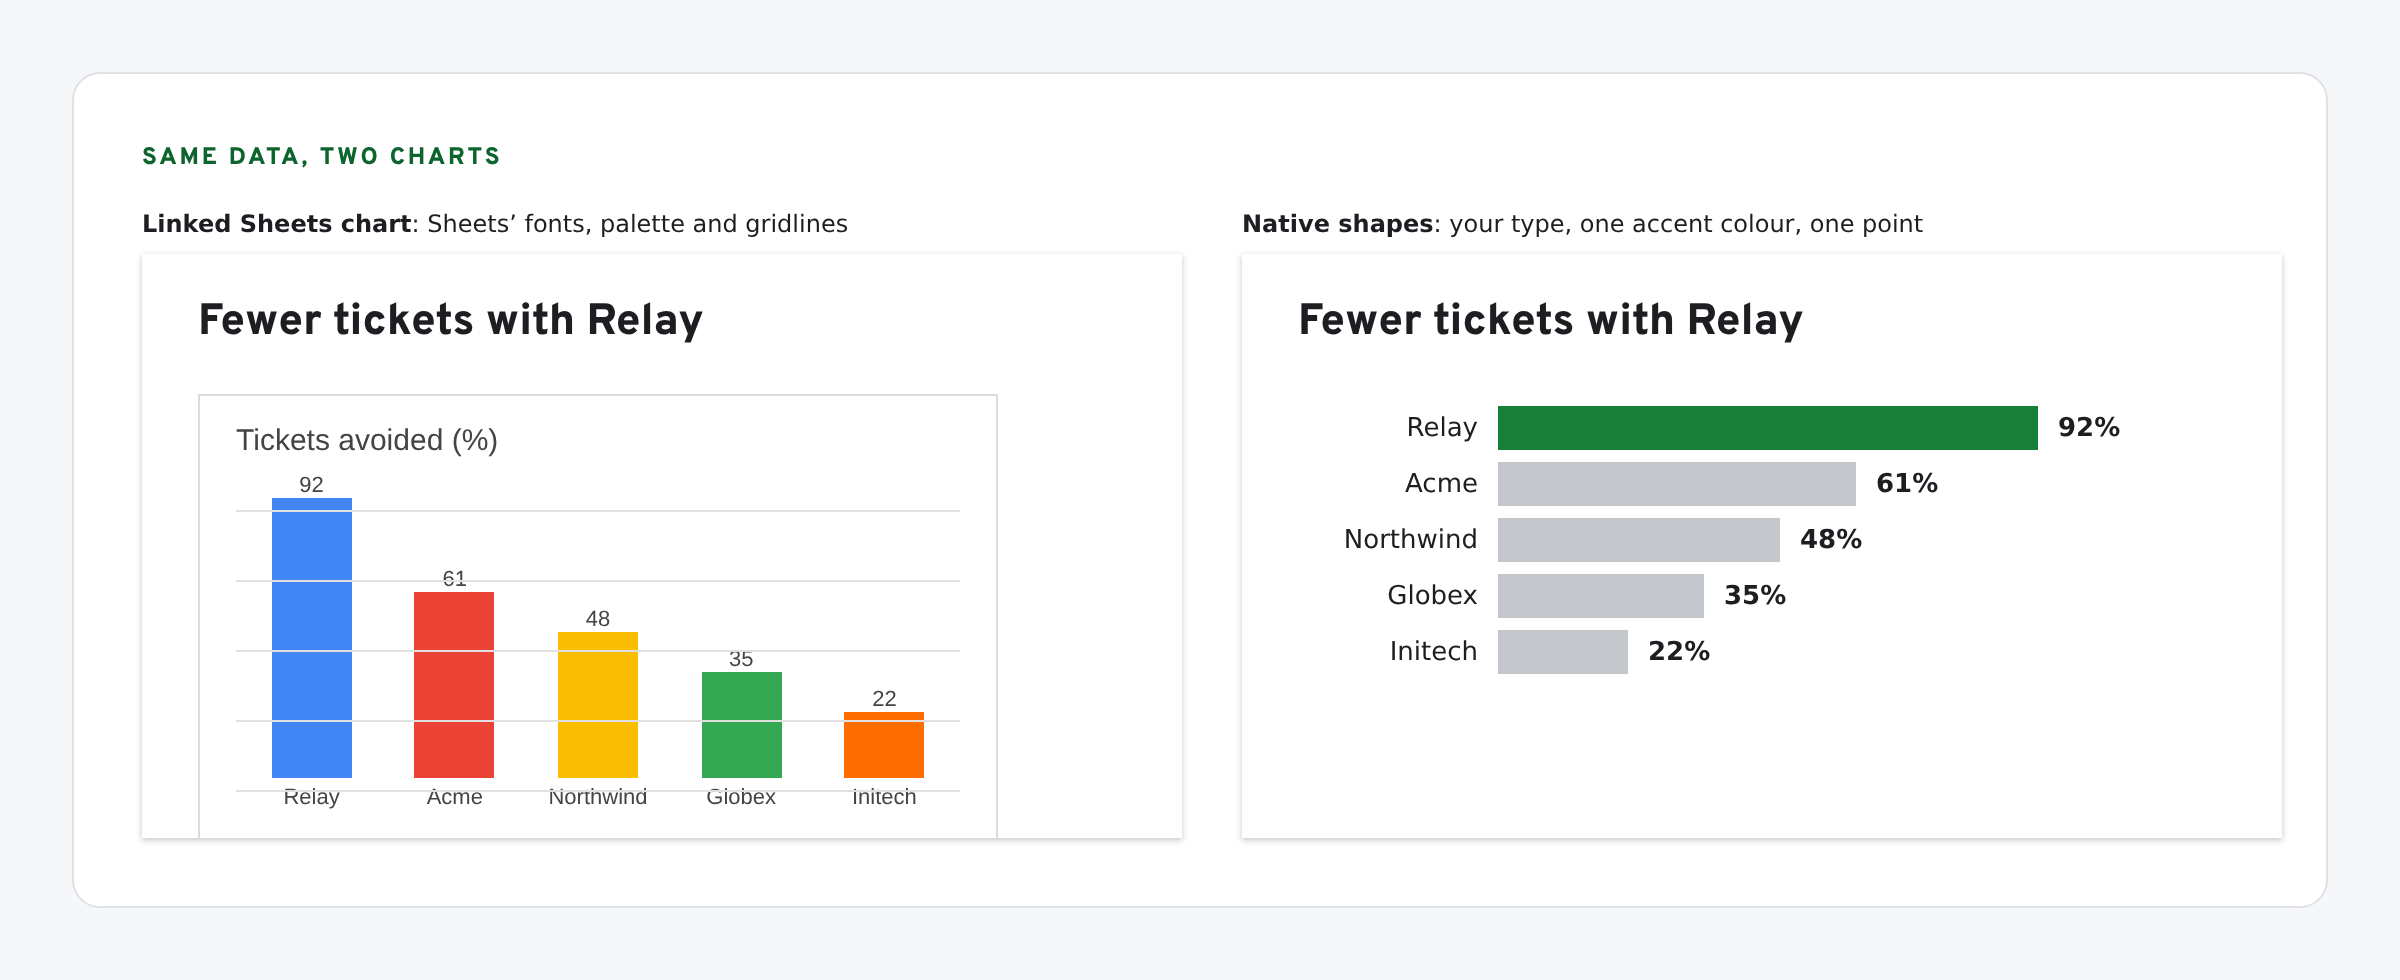
When to link, when to draw
| Use a linked chart when | Draw native shapes when |
|---|---|
| The numbers change weekly and someone clicks Update | The numbers are final for this launch or print run |
| It’s an internal review deck | It’s a customer-facing deck or one-pager |
| Accuracy matters more than look | It must match your type, colours and spacing |
Linked charts update from Tools › Linked objects. Google’s help page covers how. Everything below is for the right-hand column.
Bars: rectangles and text boxes, by script
A bar chart is rectangles and labels. Slides draws both natively, so a script can build one on the current slide from a range in Sheets. Every bar is then a shape you can recolour, and every label is text in your font.
// Draws a bar chart on the current slide as native rectangles and text boxes.
// Data: a two-column range (label, value) in the sheet named below.
const SHEET_ID = 'paste-your-sheet-id', RANGE = 'Chart!A2:B6';
const BAR = '#0066FF', INK = '#1C1E22', FONT = 'Verdana';

function drawBars() {
  const rows = SpreadsheetApp.openById(SHEET_ID).getRange(RANGE).getValues().filter(r => r[0] !== '');
  const slide = SlidesApp.getActivePresentation().getSelection().getCurrentPage().asSlide();
  const max = Math.max(...rows.map(r => r[1]));
  const left = 60, top = 80, rowH = 44, labelW = 150, maxW = 420;     // points
  rows.forEach((r, i) => {
    const y = top + i * rowH, w = Math.max(2, (r[1] / max) * maxW);
    const bar = slide.insertShape(SlidesApp.ShapeType.RECTANGLE, left + labelW, y, w, rowH - 14);
    bar.getFill().setSolidFill(BAR); bar.getBorder().setTransparent();
    text(slide, String(r[0]), left, y, labelW - 10, rowH - 14, 'END');
    text(slide, String(r[1]), left + labelW + w + 8, y, 80, rowH - 14, 'START');
  });
}

function text(slide, s, x, y, w, h, align) {
  const box = slide.insertTextBox(s, x, y, w, h);
  box.getText().getTextStyle().setFontFamily(FONT).setFontSize(12).setForegroundColor(INK);
  box.getText().getParagraphStyle().setParagraphAlignment(SlidesApp.ParagraphAlignment[align]);
  box.setContentAlignment(SlidesApp.ContentAlignment.MIDDLE);
}
Open your deck, go to Extensions › Apps Script, paste the code, set the sheet ID and range, select a slide and run drawBars. Change BAR, INK and FONT to your brand values. The SlidesApp reference covers each call.
Lines, areas, donuts: SVG to Slides
Curves need custom geometry, which a script can’t add to an existing deck. Draw them as SVG instead, in any tool that exports SVG, and bring them in with SVG to Slides.
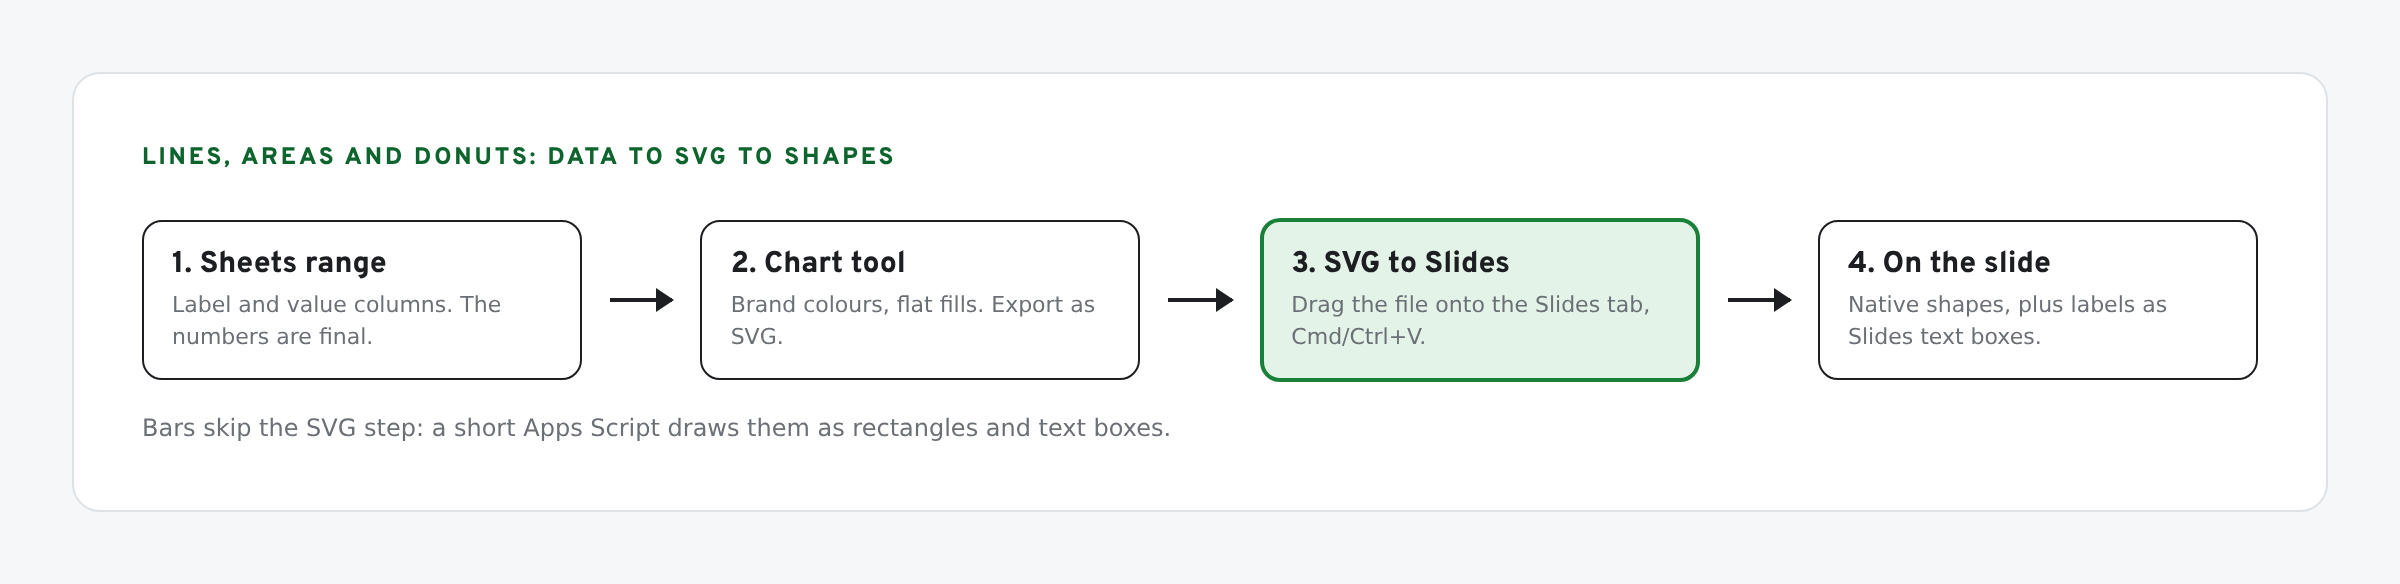
- Style the chart in brand colours before export. Flat fills, no gradients or shadows.
- Export as SVG.
- Drag the file onto your Slides tab with SVG to Slides and press Cmd/Ctrl+V. Every path lands as a native shape. See how to insert an SVG into Google Slides.
- Add labels as Slides text boxes, in your type styles. SVG text is not converted, and live labels are easier to edit and translate anyway.
Native shapes stay sharp at any size, which matters when the same chart goes on a printed one-pager. The SVG vs PNG comparison shows the difference.
Highlight one bar
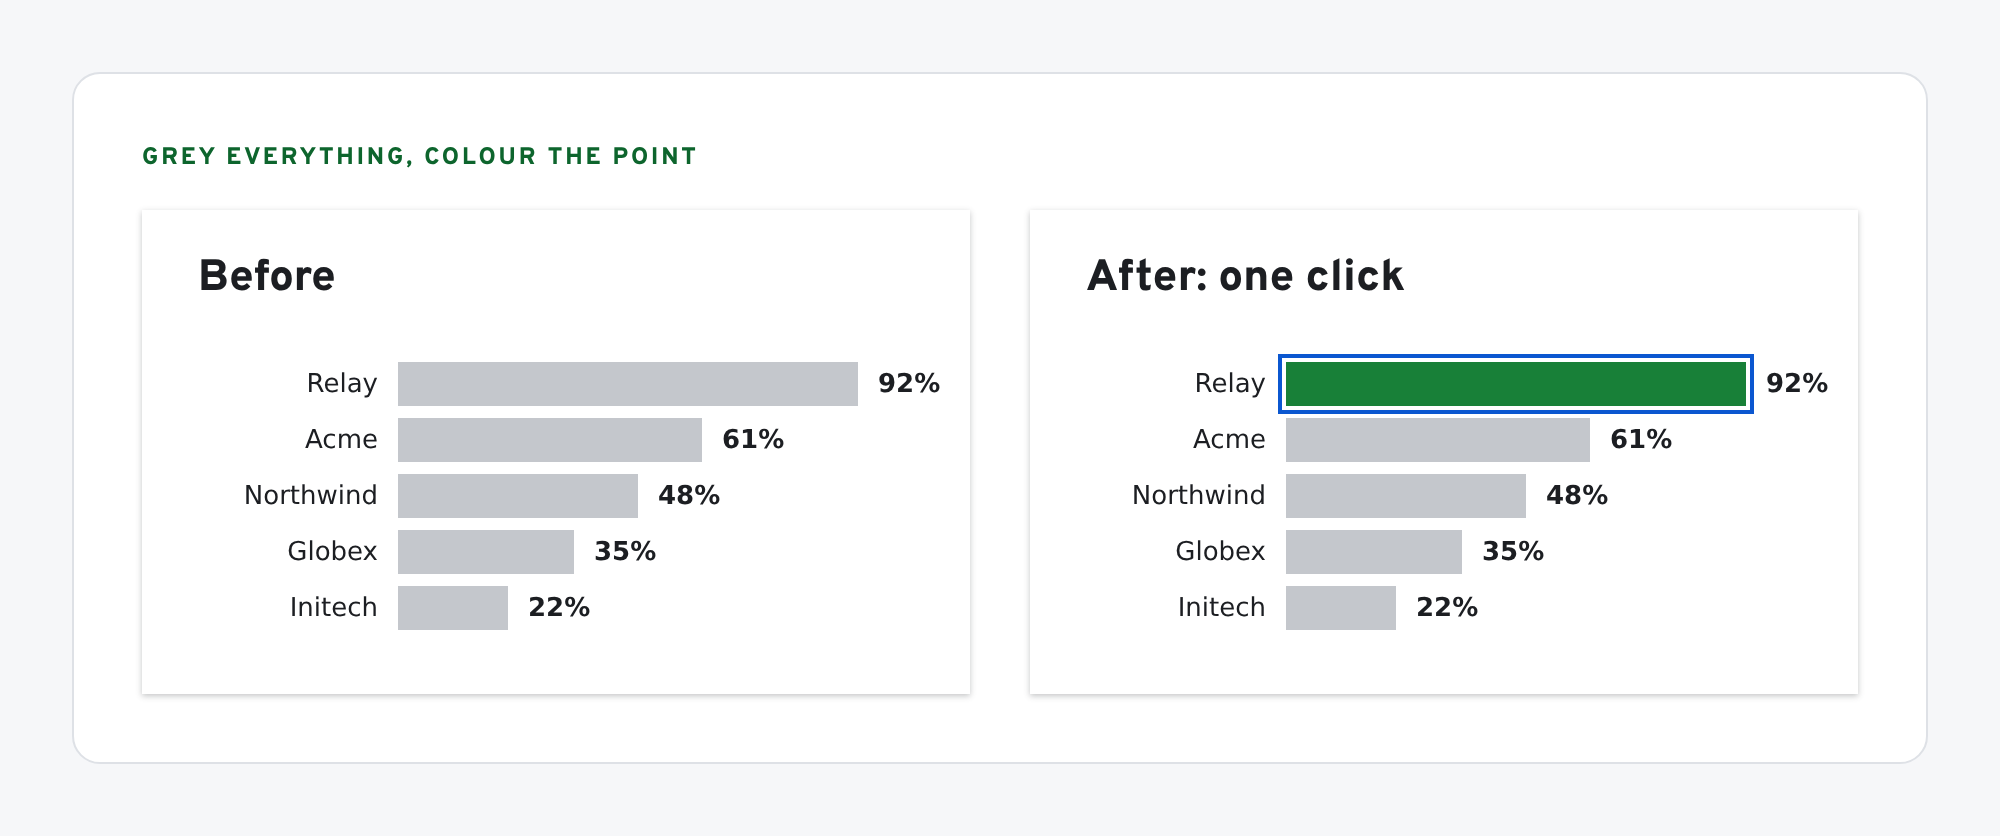
The best reason to draw charts as shapes: you can make the point of the chart obvious. Grey every bar, then recolour the one that matters. Recolouring a shape in Google Slides is one click in the fill picker.
What we have tested
- SVG to Slides converts rects, circles and paths, which is all a flat chart SVG contains. Text and gradients are the parts to check after import.
- Not yet run by us: the
drawBarsscript. It’s written against the SlidesApp reference. Run it on a copy.
If localized decks carry these charts, give the labels budgets too: see localizing a one-pager without breaking the layout.
The screens in this post are mockups, not captures of Google’s products. Google Slides, Google Sheets, Google Docs, Google Forms, Google Meet, Google Chat, Google Drive, Gemini and Google Workspace are trademarks of Google LLC.
Building decks with real design assets? SVG to Slides drops SVG logos and icons into Google Slides as native, editable shapes — recolor any part, no PNG blur. Free forever. Every feature, no daily cap, no account, no Pro tier.
 Add to Chrome — free
Related posts
Google SlidesProduct screenshots go stale. Native UI mockups don't.Nov 10, 2026Google SheetsA competitor matrix where every cell cites its sourceOct 29, 2026Google SheetsLocalize a one-pager without breaking the layoutJul 31, 2026Sources
- Google Sheets adds box and whisker charts (Android Authority, Oct 22, 2026)
- Import and create combo charts in Google Sheets (Google Workspace Updates, Jul 20, 2026)
- Create and import scatter charts with multiple x-series in Google Sheets (Google Workspace Updates, Jul 29, 2026)
- Linked objects in Google Docs, Sheets and Slides (Google Docs Editors Help)
- Slides Service reference (Google Apps Script)